
Analytical Confidence Intervals for State Occupancy Probabilities
Source:vignettes/analytical-confidence-intervals.Rmd
analytical-confidence-intervals.RmdState occupancy probabilities (SOPs), the probabilities of being in
each state at each time, are estimated from a fitted transition model,
so they inherit its uncertainty.
inferences(method = "delta") quantifies this uncertainty
analytically. It calculates how each SOP changes when the model
coefficients change slightly and combines these sensitivities with the
uncertainty in the coefficients (the delta method). Unlike
simulation or the bootstrap, it uses no random draws, so it is fast and
gives the same answer every time.
This article explains
- how to choose between conditional and unconditional variance;
- how the two variances are calculated;
- which patients enter the calculation, and why patient IDs matter;
- how the confidence limits are formed;
- how to extract variances and covariances; and
- which models and comparisons are supported.
Note that method = "delta" must be requested explicitly.
The default, method = "mvn", simulates model coefficients
instead.
Fit a model
We simulate 800 patients over 30 days with
sim_markov("actt2"), which uses the eight-state NIAID scale
described in vignette("full-po-sops"), and fit a
proportional-odds transition model with orm_markov().
id_var = "id" identifies the rows that belong to the same
patient, which the variance calculations need.
library(mostr)
library(rms)
library(patchwork)
library(ggplot2)

N_PATIENTS <- 800
FOLLOW_UP <- 30
SEED <- 20260718
ABSORB <- "8"

raw_data <- sim_markov(
  "actt2",
  n_patients = N_PATIENTS,
  follow_up_time = FOLLOW_UP,
  treatment_prob = 0.5,
  seed = SEED,
  treatment_effect = -0.5
)

plot_sops(raw_data, linetype_var = "tx", facet_var = NULL)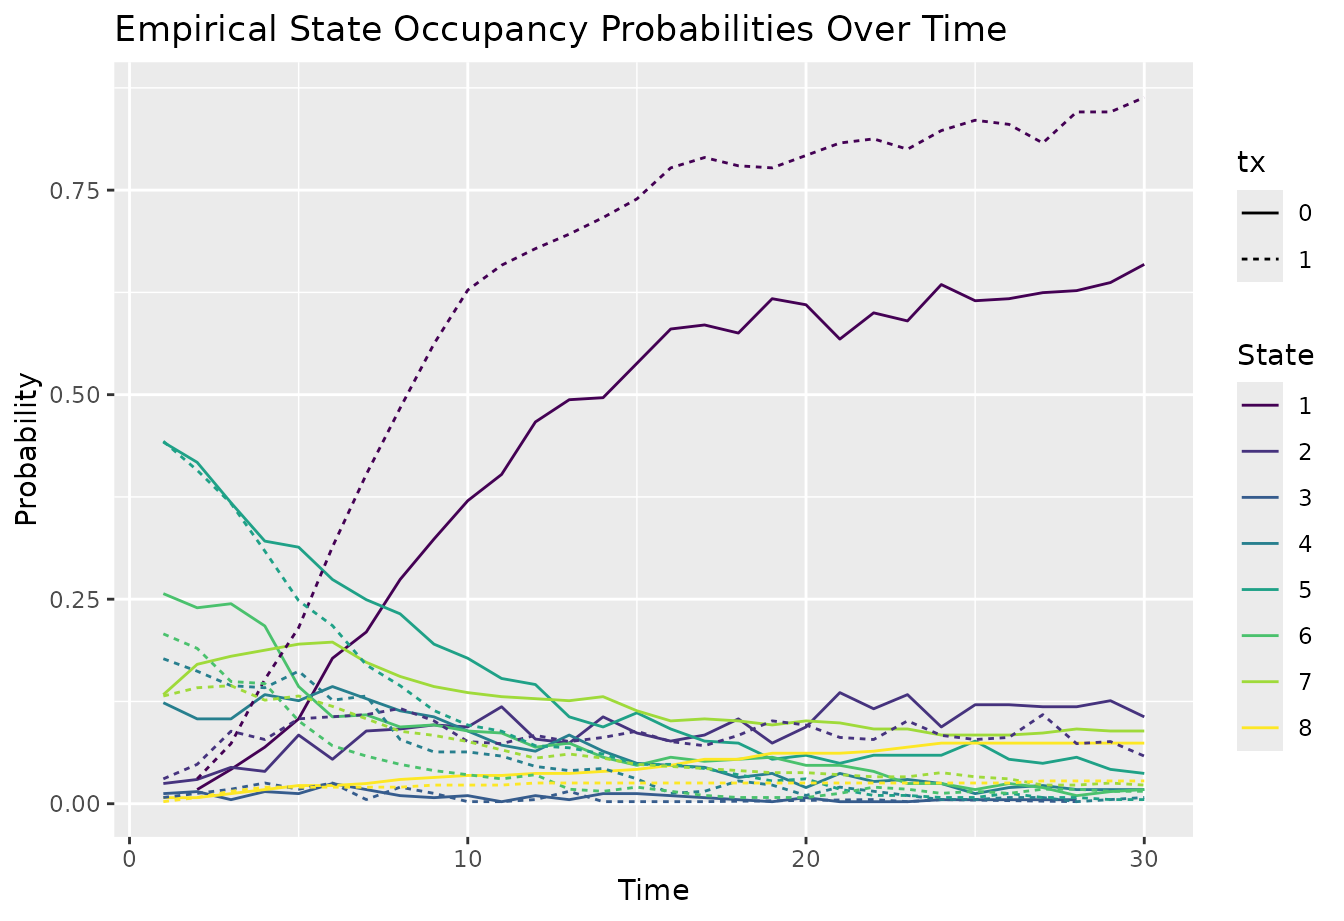
model_data <- prepare_markov_data(
  raw_data,
  absorbing_state = as.integer(ABSORB)
)

dd <- rms::datadist(model_data)
options(datadist = "dd")

fit <- orm_markov(
  y ~ tx + time + yprev,
  data = model_data,
  id_var = "id",
  opt_method = "LM",
  scale = TRUE,
  maxit = 100
)
Choose conditional or unconditional variance
An averaged SOP, such as the probability of being at home on day 14
if every patient had received treatment, depends on two things: the
model coefficients and the patients over whom we average. The
vcov argument of inferences() decides which of
these count as uncertain.
-
Conditional variance,
vcov = "conditional", accounts for uncertainty in the estimated coefficients but treats the patients’ starting states and covariates as given. It answers: how precisely have we estimated the average for these particular patients? -
Unconditional variance,
vcov = "unconditional", additionally accounts for which patients happened to be sampled, and for the fact that the same patients were used to estimate the coefficients. It answers: how precisely have we estimated the average in the population the patients were drawn from?
Both give the same point estimates; only the standard errors and confidence intervals differ. Unconditional intervals are usually wider, most visibly early in follow-up, when SOPs depend strongly on the patients’ starting states.
Averaged SOPs from avg_sops() and comparisons from
avg_comparisons() use unconditional variance by default.
Patient-level SOPs from sops() support only conditional
variance, since there is no average over sampled patients.
Conditional variance
Let \(i = 1,\ldots,n\) index
patients, and let \(\beta\) be the
vector of all \(p\) model coefficients,
with estimate \(\hat\beta\). For
patient \(i\), the column vector \(h_i(\beta)\) stacks the predicted
probabilities \(S_{it}(l)\) for all
requested times \(t\) and states \(l\). Write \(h_i
= h_i(\hat\beta)\) for the fitted values and \(\bar h = n^{-1}\sum_{i=1}^n h_i\) for their
average, which is what avg_sops() reports.
The matrix \(G_i\) describes how patient \(i\)’s predictions change with the coefficients: it contains the derivatives of \(h_i(\beta)\) with respect to \(\beta^\top\) at \(\hat\beta\), with one row per prediction and one column per coefficient. The average prediction changes according to \(\bar G = n^{-1}\sum_{i=1}^n G_i\). If \(V_\beta\) is the estimated covariance matrix of the coefficients, the conditional covariance matrix of the averaged SOPs is
\[ \bar G V_\beta \bar G^\top. \]
The square roots of its diagonal entries are the standard errors.
By default, \(V_\beta\) is the fit’s
patient-cluster robust covariance, which allows for the
correlation between a patient’s repeated transitions. There are two
fitting options in orm_markov() and
vglm_markov() that allow adjustment for small samples:
-
type = "HC1"multiplies it by \((m - 1)/(m - p)\), where \(m\) is the number of rows used in fitting (rows with positive weight, fororm_markov()) and \(p\) is the number of coefficients.type = "HC0"applies no such factor, and is used by default. -
cadjust = TRUEmultiplies it by \(n/(n - 1)\), where \(n\) is the number of patients. Fits withid_varuse this adjustment by default.
Conditional variance, like MVN simulation, also works for weighted
and penalized orm_markov() fits whose fitted covariance is
valid.
# compute sops
t1 <- Sys.time()
avg_conditional <- avg_sops(
  fit,
  variables = list(tx = c(0, 1)),
  times = seq_len(FOLLOW_UP),
  y_levels = fit$yunique,
  absorb = ABSORB
) |> inferences(
  method = "delta",
  vcov = "conditional",
  conf_type = "auto"
)
t2 <- Sys.time()
t2 - t1
#> Time difference of 1.084971 secs
# compute time in state
time_conditional <- avg_time(
  fit,
  variables = list(tx = c(0, 1)),
  times = seq_len(FOLLOW_UP),
  y_levels = fit$yunique,
  absorb = ABSORB
) |>
  inferences(
    method = "delta",
    vcov = "conditional",
  )

# compute differences in time in state
comp_conditional <- avg_comparisons(
  fit,
  variables = list(tx = c(0, 1)),
  times = seq_len(FOLLOW_UP),
  y_levels = fit$yunique,
  absorb = ABSORB,
  estimand = "time_in_state",
  comparison = "difference"
) |>
  inferences(
    method = "delta",
    vcov = "conditional",
    # specify null hypothesis, here no difference on additive scale
    null = 0
  )

p1.sops <- plot_sops(avg_conditional, linetype_var = "tx", facet_var = NULL) +
  labs(title = "Conditional variance")

p1.c <- plot_comparisons(comp_conditional) +
  labs(title = "Conditional variance")
Unconditional variance
The unconditional calculation adds a second source of variation: had a different set of patients enrolled, both the average of their predictions and the fitted coefficients would have changed, and these two changes are related. Each patient’s contribution to both is captured in one vector,
\[ \phi_i = h_i - \bar h + \bar G A^{-1}s_i. \]
The first part, \(h_i - \bar h\), is how far patient \(i\)’s predictions lie from the average. The second part is the patient’s influence on the coefficients, translated into its effect on the average prediction through \(\bar G\). In it,
- \(s_i = \sum_{r \in \mathcal{I}_i}\psi_r\) is the patient’s score: the sum, over the patient’s fitting rows \(\mathcal{I}_i\), of the derivatives \(\psi_r = \partial\ell_r/\partial\beta\) of each row’s log-likelihood \(\ell_r\), evaluated at \(\hat\beta\);
-
\(A^{-1} = nB\), where \(B\) is the inverse of the fit’s total
information matrix, before any
typeorcadjustcorrection. With the default observed information, \(A\) is the negative derivative of the average patient score; a fit that uses a different (working) information matrix uses that matrix instead.
Thus \(A^{-1}s_i\) approximates how much patient \(i\) moves the estimated coefficients. The unconditional covariance matrix is the sample covariance of the \(\phi_i\) divided by \(n\):
\[ V_{\mathrm{unconditional}} = \frac{1}{n(n-1)} \sum_{i=1}^n (\phi_i - \bar\phi)(\phi_i - \bar\phi)^\top, \qquad \bar\phi = n^{-1}\sum_{i=1}^n \phi_i. \]
In R terms, this is stats::cov(phi) / n, where
stats::cov() uses the usual divisor \(n - 1\). Because the two parts of \(\phi_i\) are combined before taking the
covariance, their correlation in the observed sample is retained. The
fitting options type and cadjust do not change
this estimate.
avg_unconditional <- avg_sops(
  fit,
  variables = list(tx = c(0, 1)),
  times = seq_len(FOLLOW_UP),
  y_levels = fit$yunique,
  absorb = ABSORB
) |> inferences(
  method = "delta",
  vcov = "unconditional",
  conf_type = "wald"
)

# compute time in state
time_unconditional <- avg_time(
  fit,
  variables = list(tx = c(0, 1)),
  times = seq_len(FOLLOW_UP),
  y_levels = fit$yunique,
  absorb = ABSORB
) |>
  inferences(
    method = "delta",
    vcov = "unconditional",
  )


comp_unconditional <- avg_comparisons(
  fit,
  variables = list(tx = c(0, 1)),
  times = seq_len(FOLLOW_UP),
  y_levels = fit$yunique,
  absorb = ABSORB,
  estimand = "time_in_state",
  comparison = "difference"
) |>
  inferences(
    method = "delta",
    vcov = "unconditional",
    null = 0
  )

p2.sops <- plot_sops(avg_unconditional, linetype_var = "tx", facet_var = NULL) +
  labs(title = "Unconditional variance")

p2.c <- plot_comparisons(comp_unconditional) +
  labs(title = "Unconditional variance")
The plots below compare the two choices, first for the SOPs and then for the differences in expected time in each state (treated minus control). The point estimates are identical; the intervals differ.
p1.sops + p2.sops + plot_layout(guides = "collect")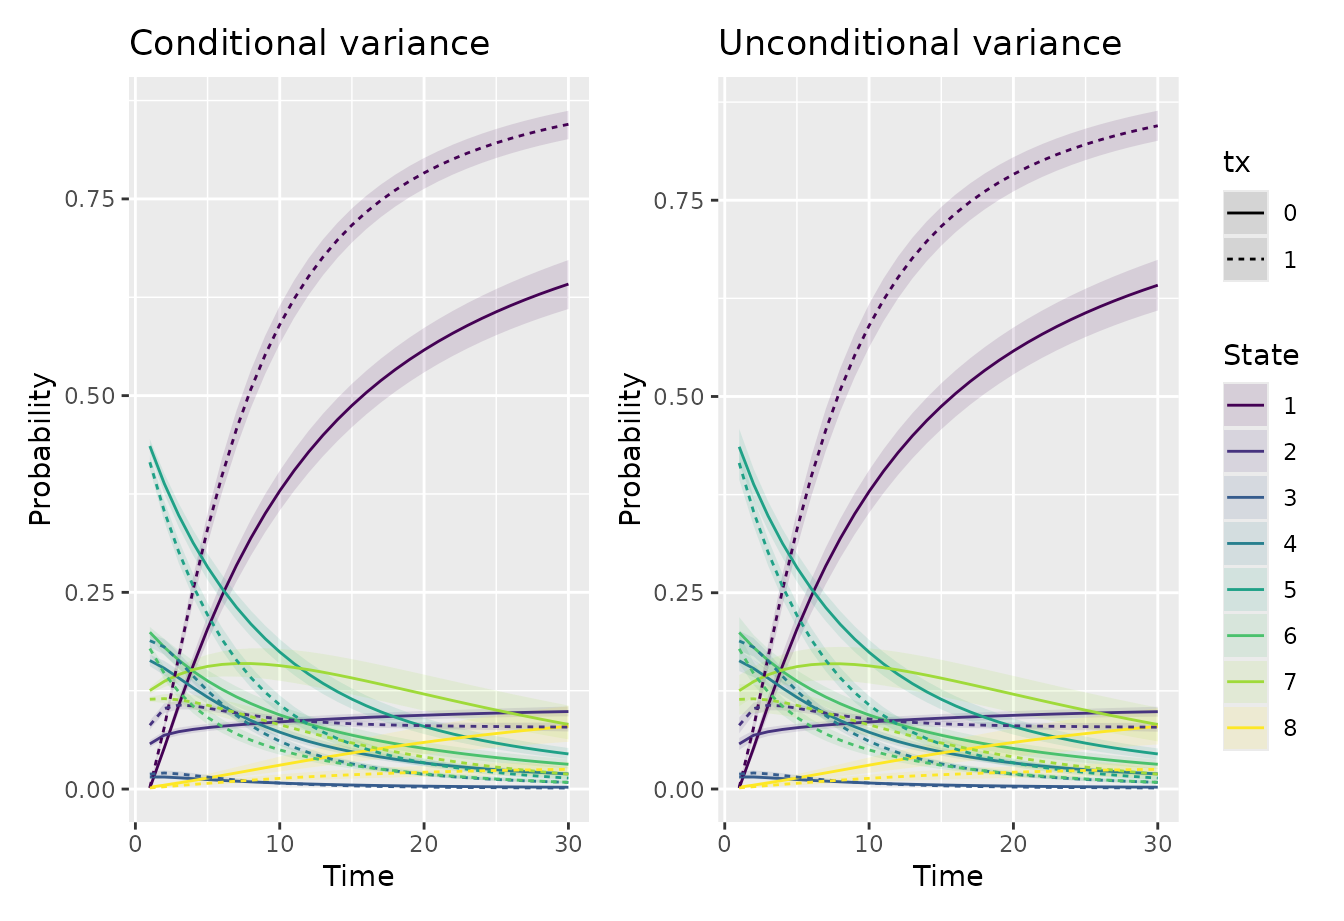
p1.c + p2.c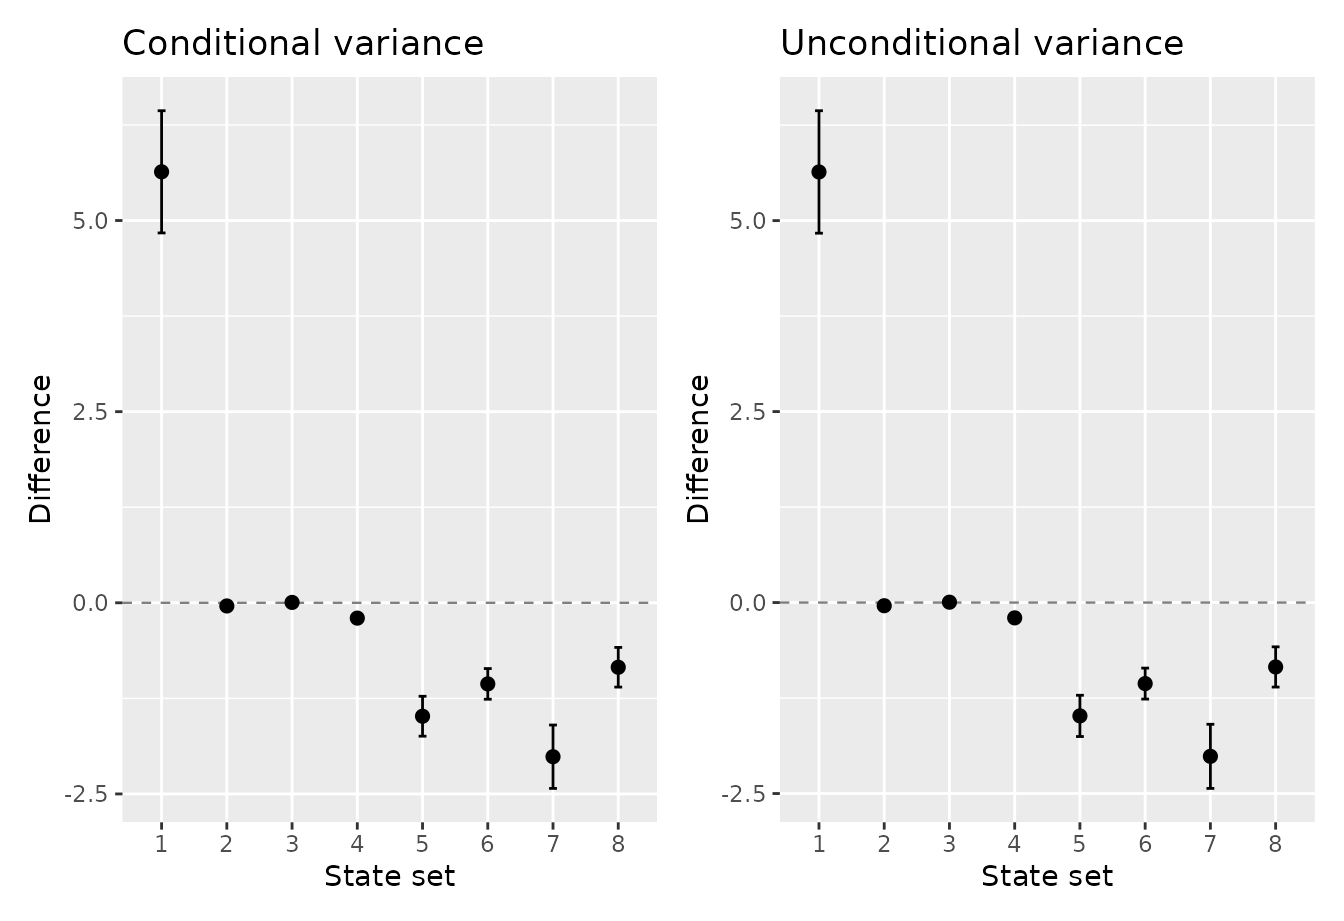
We can also plot the expect time in each state by arm using Grotta bars:
plot_time(time_conditional, show_labels = FALSE)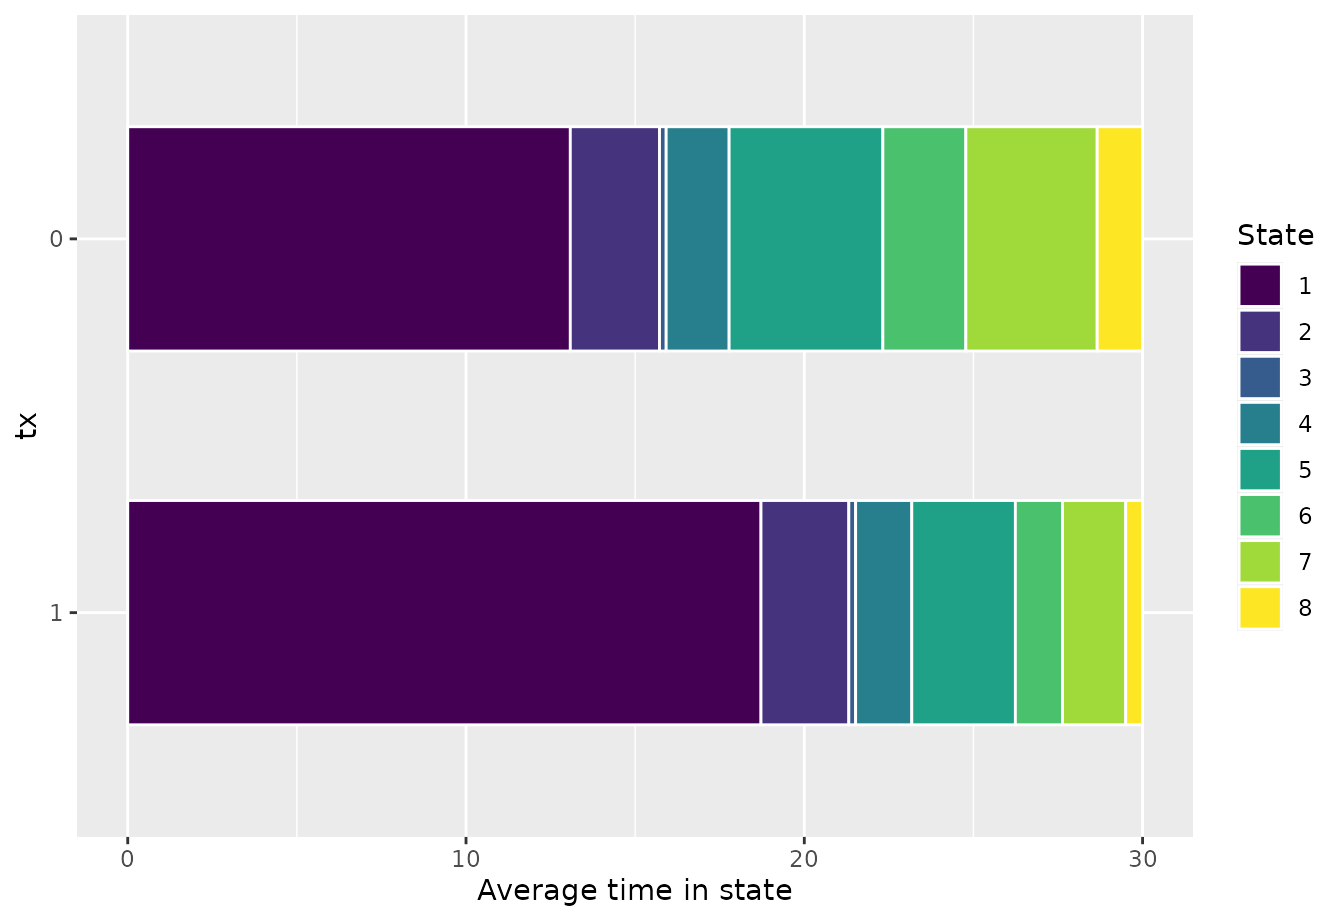
If we want to show uncertainty, we can plot the expected time differently as well:
plot_time(time_conditional, show_labels = FALSE, type = "pointrange")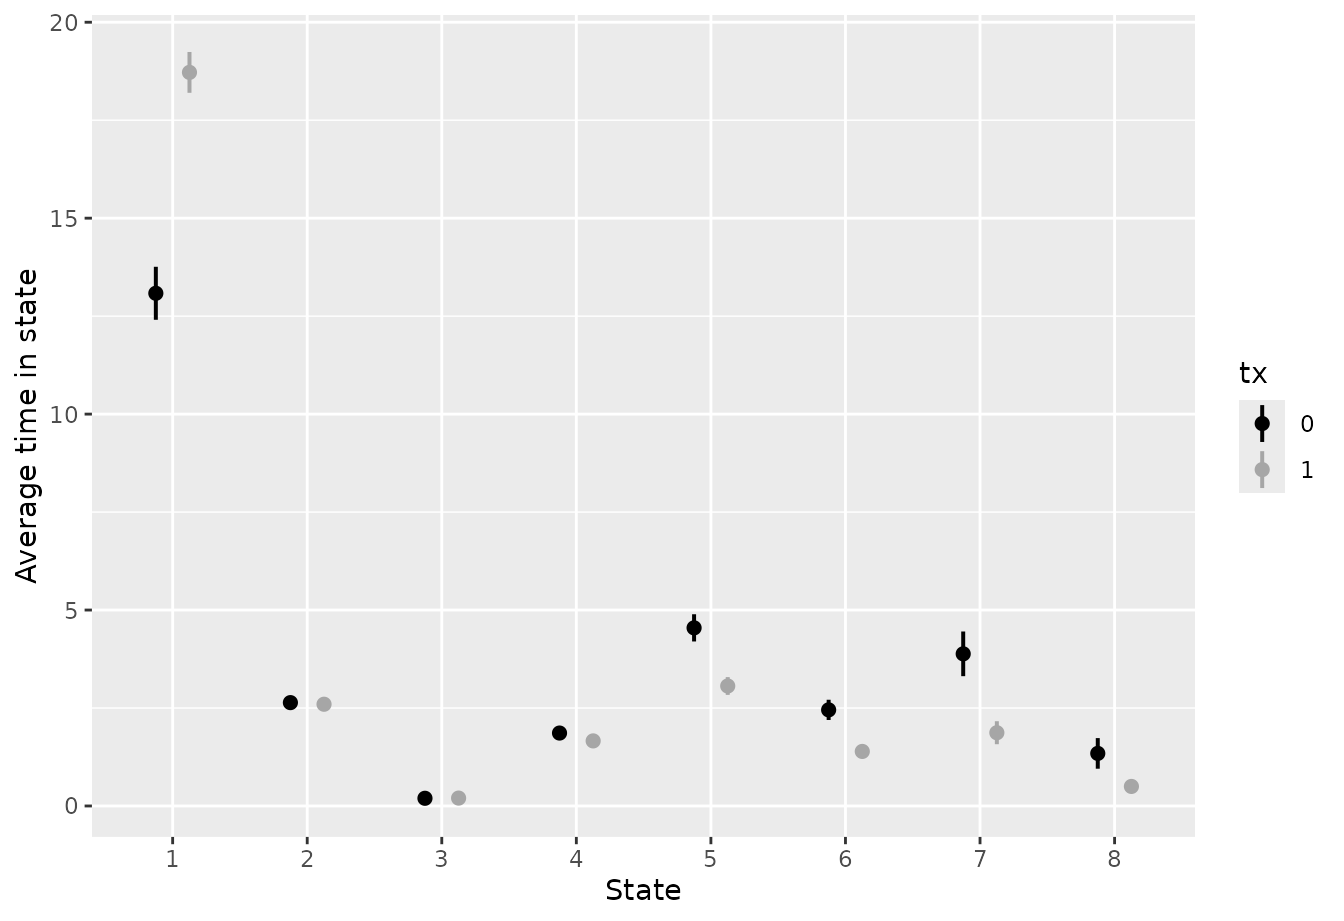
Requirements for unconditional variance
Unconditional variance needs each patient’s scores, so it is available only when
- the model was fitted with
orm_markov()orvglm_markov(), which store the patient information needed; models fitted directly withrms::orm()orVGAM::vglm()cannot be used for analytical intervals at all; - the average is taken over the patients stored with the model, not
over user-supplied
newdata; and - the
orm_markov()fit is neither weighted nor penalized.
If a requirement is not met, inferences() stops with an
error rather than silently switching to conditional variance. With
newdata, for example, request
vcov = "conditional" explicitly.
Which patients are included in the average?
Without newdata, predictions start from each fitted
patient’s row at the first follow-up time,
first_followup_time: that row supplies the patient’s
starting state (yprev) and covariates. The model stores
these rows before dropping rows with missing outcomes. Therefore:
- each patient must have exactly one row at that time, with ID,
predictors, time, and
yprevall observed; - the outcome on that row may be missing, provided the patient contributes at least one other transition to the fit;
- a later row cannot stand in for missing starting information.
For numeric time, first_followup_time defaults to 1,
which must be the earliest scheduled time. If you set another value, it
must still be the earliest. For factor or character time, you must set
it explicitly; see vignette("factor-time-orm-sops").
Neither variance corrects bias caused by missing observations whose missingness depends on unobserved outcomes.
Why patient IDs matter
Each patient contributes many transitions to the model, and these are not independent. Treating them as independent would typically make standard errors too small. mostr therefore groups the fitting rows by patient, identifying patients as follows:
- If you pass
clustertoinferences(), its entries identify the patient for each fitting row, in the order of the fitting data. - Otherwise, mostr uses the
id_varcolumn given toorm_markov()orvglm_markov(). - Without patient IDs, patient-cluster robust variance cannot be calculated.
For conditional variance, you can instead supply your own coefficient
covariance matrix through vcov. It must cover all model
coefficients, with matching names. Supplying a matrix always selects
conditional variance, because a matrix alone does not carry the
patient-level scores that unconditional variance needs.
Grouping by patient corrects the standard errors for within-patient correlation. It does not correct for a transition model that describes the data poorly, nor for bias from missing observations.
Logit and Wald intervals
conf_type controls how confidence limits are formed from
the estimate and its standard error.
-
conf_type = "auto", the default, forms intervals for probabilities on the logit scale and transforms the limits back. This keeps them between 0 and 1. -
conf_type = "wald"uses the estimate plus or minus a normal quantile times the standard error. Its limits can fall below 0 or above 1.
Differences between arms can be negative, so analytical intervals for
differences always use the Wald form; conf_type = "auto"
selects it automatically.
If an estimated probability is exactly 0 or 1, its logit is undefined
and the logit-scale limits are returned as NA with a
warning, even when the standard error is 0. Such values can arise from
rounding and do not necessarily mean that the outcome is certain. This
applies to absorbing states too: patients who enter one stay there, but
the probability of entering it is still estimated.
Each interval covers one estimate at the stated confidence level. The level does not apply jointly to all intervals.
The example below compares the average probability of being outside hospital (states 1 and 2 combined) between arms, as treated minus control.
sop_difference <- avg_comparisons(
  fit,
  variables = list(tx = c(0, 1)),
  estimand = "sop",
  state_sets = c("1", "2"),
  comparison = "difference",
  times = seq_len(FOLLOW_UP),
  y_levels = fit$yunique,
  absorb = ABSORB
) |>
  inferences(
    method = "delta",
    vcov = "conditional",
    conf_type = "auto"
  )

head(sop_difference)
Show output
#>   estimand time state_set term reference_level comparison_level contrast
#> 1      sop    1       1+2   tx               0                1    1 - 0
#> 2      sop    2       1+2   tx               0                1    1 - 0
#> 3      sop    3       1+2   tx               0                1    1 - 0
#> 4      sop    4       1+2   tx               0                1    1 - 0
#> 5      sop    5       1+2   tx               0                1    1 - 0
#> 6      sop    6       1+2   tx               0                1    1 - 0
#>   comparison   estimate   std.error statistic      p.value  s.value   conf.low
#> 1 difference 0.02442457 0.001881880  12.97881 1.613621e-38 125.5430 0.02073616
#> 2 difference 0.06010226 0.004543741  13.22748 6.089186e-40 130.2709 0.05119669
#> 3 difference 0.09537444 0.007102533  13.42823 4.131719e-41 134.1523 0.08145373
#> 4 difference 0.12629464 0.009283731  13.60387 3.798044e-42 137.5957 0.10809887
#> 5 difference 0.15188351 0.011054653  13.73933 5.902080e-43 140.2817 0.13021678
#> 6 difference 0.17231621 0.012457397  13.83244 1.624134e-43 142.1432 0.14790016
#>    conf.high
#> 1 0.02811299
#> 2 0.06900782
#> 3 0.10929515
#> 4 0.14449042
#> 5 0.17355023
#> 6 0.19673226
The standard error of a difference accounts for both arms’ predictions coming from the same fitted model and the same patients; the two arms are not treated as independent.
estimand = "time_in_state" compares the expected time
spent in a state instead, as in the plots above. For visits recorded as
a factor, supply the elapsed time of each visit;
vignette("factor-time-orm-sops") shows how, and how to
include the observed baseline state.
Extract variances and covariances
The output of inferences() already contains standard
errors and confidence limits. To learn how the uncertainty in different
estimates is related, for example to test a combination of estimates
yourself, use vcov(). It returns the covariance matrix of
the estimates: its diagonal entries are variances, and the off-diagonal
entries are covariances between pairs of estimates. The matrix reflects
the conditional or unconditional choice made in
inferences().
The example requests the first six estimates only. The square roots
of the diagonal are their standard errors, matching the
std.error column.
rows <- seq_len(min(6L, nrow(avg_conditional)))

conditional_covariance <- stats::vcov(avg_conditional, rows = rows)
unconditional_covariance <- stats::vcov(avg_unconditional, rows = rows)

sqrt(diag(conditional_covariance))
#> 1\r1\r0 2\r1\r0 3\r1\r0 4\r1\r0 5\r1\r0 6\r1\r0
#> 0.000186052 0.002331517 0.004498137 0.006499989 0.008220933 0.009639445#> 1\r1\r0 2\r1\r0 3\r1\r0 4\r1\r0 5\r1\r0 6\r1\r0
#> 0.0001975683 0.0037044533 0.0061500033 0.0080427528 0.0096023821 0.0108847730Without rows, vcov() returns a covariance
for every pair of estimates. This can use a lot of memory, because
doubling the number of estimates quadruples the number of entries, so
request only the rows you need. The option
mostr.delta_max_bytes, 256 MiB by default, caps the largest
memory allocations made by analytical inference and by
vcov().
If you want to see the derivatives \(\bar G\) themselves, the internal function below returns them for the selected estimates: one row per estimate and one column per coefficient. They enter both variances, but they do not include the patient-sampling part of the unconditional variance.
coefficient_derivatives <- mostr:::get_jacobian(avg_conditional, rows = rows)
coefficient_derivatives
Show output
#>                 y>=2        y>=3          y>=4         y>=5          y>=6
#> 1\r1\r0 -0.001132096  0.00000000  0.0000000000  0.000000000  0.0000000000
#> 2\r1\r0 -0.007897314 -0.03831245 -0.0005617418 -0.000552515 -0.0000205348
#> 3\r1\r0 -0.014889904 -0.05684628 -0.0120334389 -0.023947529 -0.0012861407
#> 4\r1\r0 -0.021418085 -0.06775362 -0.0215985495 -0.054444192 -0.0059654399
#> 5\r1\r0 -0.027381303 -0.07428878 -0.0290197864 -0.084149822 -0.0137423083
#> 6\r1\r0 -0.032780378 -0.07805951 -0.0346634556 -0.110222302 -0.0235881328
#>                  y>=7          y>=8 tx         time      yprev=2       yprev=3
#> 1\r1\r0  0.000000e+00  0.000000e+00  0 -0.001132096  0.000000000  0.0000000000
#> 2\r1\r0 -1.562830e-07 -8.915904e-11  0 -0.055244435 -0.006472823 -0.0002455501
#> 3\r1\r0 -1.164646e-05 -7.617800e-09  0 -0.178647307 -0.007804784 -0.0035469850
#> 4\r1\r0 -1.500138e-04 -1.566666e-07  0 -0.362575448 -0.008386908 -0.0061036095
#> 5\r1\r0 -6.627916e-04 -1.256310e-06  0 -0.595549939 -0.008782520 -0.0079874248
#> 6\r1\r0 -1.742042e-03 -5.401704e-06  0 -0.866066782 -0.009086313 -0.0093624370
#>               yprev=4       yprev=5       yprev=6       yprev=7
#> 1\r1\r0 -0.0009821635 -0.0001486524 -1.275389e-06 -4.301474e-09
#> 2\r1\r0 -0.0314564092 -0.0089479204 -9.156997e-05 -3.610841e-07
#> 3\r1\r0 -0.0581727996 -0.0325167493 -9.977764e-04 -7.038963e-06
#> 4\r1\r0 -0.0803894811 -0.0604663709 -3.729421e-03 -5.125895e-05
#> 5\r1\r0 -0.0981477259 -0.0877595745 -8.257507e-03 -1.929785e-04
#> 6\r1\r0 -0.1119021577 -0.1124334843 -1.419358e-02 -4.888766e-04
Supported models and comparisons
Analytical confidence intervals are available for:
- first-order Markov models, where the next state depends only on the previous state and the covariates;
- full proportional-odds models with a reverse cumulative-logit link;
- frequentist models fitted with
orm_markov()orvglm_markov()(including therobcov_vglmobject thatvglm_markov()returns); - patient-level SOPs from
sops()with conditional variance, and averaged SOPs fromavg_sops()with conditional or unconditional variance; - differences with
estimand = "sop"orestimand = "time_in_state"; and - numeric or factor visit times.
For other models, such as partial proportional-odds or second-order
models, or for estimand = "time_benefit", use simulation or
the bootstrap; see
vignette("mvn-vs-bootstrap-orm-sops").