
Partial Proportional-Odds SOPs with vglm_markov()
Source:vignettes/partial-po-vglm-sops.Rmd
partial-po-vglm-sops.RmdA proportional-odds model assumes that each covariate shifts the odds of being in a worse state by the same factor at every cut-point of the ordinal scale. For example, the effect of time on the odds of being in hospital or worse is assumed to equal its effect on the odds of death. When this assumption is doubtful for some covariates, a partial proportional-odds model lets their effects differ between cut-points while keeping proportional odds for the others.
This article fits both kinds of model to the same data with
vglm_markov(): a full proportional-odds model, and a
partial proportional-odds model in which the effect of time differs
between the cut-points. We compare how well the two models fit, and how
closely each reproduces the observed state occupancy probabilities
(SOPs), transitions, and correlations between days.
Simulate data
We simulate 1,000 patients over 28 days with
sim_markov("violet"). Its trajectories resemble those of
the VIOLET trial of
vitamin D3 in critically ill adults, and each patient’s starting state,
age, and SOFA (Sequential Organ Failure Assessment) score are drawn from
the VIOLET patients. There are four states:
| State | Meaning |
|---|---|
| 1 | At home |
| 2 | In hospital or another health care facility |
| 3 | On a ventilator or with acute respiratory distress syndrome (ARDS) |
| 4 | Dead |
Death is absorbing. Treated patients (tx = 1) have 0.8
times the odds of being in a worse state on any day.
The simulator itself is a partial proportional-odds model, described
in ?violet_preset. Time enters as a straight line whose
slope changes after day 2, and both slopes differ between the three
cut-points. During the first two days, each day lowers the log odds of
being in hospital or worse by 1.315, so many patients go home, but
raises the log odds of death by 0.412. After day 2 all three slopes are
close to zero. A single time effect shared by all cut-points cannot
describe both trends, so we can check which model recovers this
structure.
library(mostr)
library(ggplot2)
library(patchwork)
library(rms)
library(VGAM)

N_PATIENTS <- 1000
FOLLOW_UP <- 28
SEED <- 20261009
STATE_LEVELS <- as.character(1:4)
ABSORB <- "4"

raw_data <- sim_markov(
  "violet",
  n_patients = N_PATIENTS,
  follow_up_time = FOLLOW_UP,
  treatment_effect = log(0.8),
  seed = SEED
)

model_data <- prepare_markov_data(raw_data, absorbing_state = 4)
Fit the proportional-odds model
Both models use treatment, the previous state, age, SOFA score, and
the same time trend as the simulator: time and
pmax(time - 2, 0), the number of days after day 2. Together
they form a straight line whose slope changes after day 2.
In VGAM, cumulative(reverse = TRUE) models the odds of
worse (higher) states, and parallel = TRUE requests
proportional odds for every term.
form <- ordered(y) ~ tx + time + pmax(time - 2, 0) + yprev + age + sofa

fit_po <- vglm_markov(
  form,
  family = VGAM::cumulative(reverse = TRUE, parallel = TRUE),
  data = model_data,
  id_var = "id"
)
Specify which effects may vary
VGAM expresses partial proportional odds through constraint matrices. The model has one linear predictor per cut-point; with four states there are three, for “state 2 or worse”, “state 3 or worse”, and “state 4” (dead). Each model term has a constraint matrix with one row per cut-point and one column per coefficient for that term:
- a single column of ones gives one coefficient shared by all cut-points, which is proportional odds;
- an identity matrix, with one column per cut-point, gives the term a separate coefficient at every cut-point.
The easiest way to obtain a valid set of constraint matrices is to fit the proportional-odds model first and edit its constraints. We change two things:
- The two time terms get identity matrices, so that each cut-point has its own time slopes, as in the simulator.
- The fitted model lists a separate constraint for each dummy variable
of the factor
yprev. The constraints we supply must instead be named by the formula term, so we replace these entries with a singleypreventry with proportional odds.
constraints <- fit_po$vglm_fit@constraints

# One row per cut-point: three for four states.
n_thresholds <- nrow(constraints[["time"]])

# Replace the per-dummy yprev constraints with one term-level entry.
yprev_terms <- grep("^yprev", names(constraints), value = TRUE)
constraints[yprev_terms] <- NULL
constraints[["yprev"]] <- cbind(PO_effect = rep(1, n_thresholds))

# A separate time slope at each cut-point.
time_terms <- c("time", "pmax(time - 2, 0)")
constraints[time_terms] <- list(diag(n_thresholds))
constraints[["time"]]
#> [,1] [,2] [,3]
#> [1,] 1 0 0
#> [2,] 0 1 0
#> [3,] 0 0 1Fit the partial proportional-odds model
We refit the model with these constraints.
parallel = FALSE tells VGAM not to impose proportional odds
on every term, so that our constraint matrices decide instead. Starting
from the proportional-odds fit’s linear predictors
(etastart) helps the fit converge. The final line stores
the constraint list itself, rather than the name
constraints, in the model call, so that code that later
re-evaluates the call does not depend on this variable.
fit_ppo <- vglm_markov(
  form,
  family = VGAM::cumulative(reverse = TRUE, parallel = FALSE),
  data = model_data,
  id_var = "id",
  constraints = constraints,
  etastart = fit_po$vglm_fit@predictors
)
fit_ppo$vglm_fit@call$constraints <- constraints
VGAM numbers the coefficients of a term by the columns of its
constraint matrix, so the time slopes of the partial proportional-odds
model end in :1 for “state 2 or worse”, :2 for
“state 3 or worse”, and :3 for death. The proportional-odds
model has one slope for each time term. We compare both with the slopes
used by the simulator:
coef_po <- coef(fit_po$vglm_fit)
coef_ppo <- coef(fit_ppo$vglm_fit)

data.frame(
  term = rep(time_terms, each = n_thresholds),
  cutoff = rep(c("hospital or worse", "ventilator/ARDS or dead", "dead"), 2),
  PO = rep(coef_po[time_terms], each = n_thresholds),
  PPO = coef_ppo[paste0(rep(time_terms, each = n_thresholds), ":", 1:3)],
  simulated = c(-1.315, -0.481, 0.412, 1.384, 0.525, -0.410),
  row.names = NULL
)
#> term cutoff PO PPO simulated
#> 1 time hospital or worse -0.7992013 -1.4110546 -1.315
#> 2 time ventilator/ARDS or dead -0.7992013 -0.5612482 -0.481
#> 3 time dead -0.7992013 0.3639808 0.412
#> 4 pmax(time - 2, 0) hospital or worse 0.8537469 1.4796290 1.384
#> 5 pmax(time - 2, 0) ventilator/ARDS or dead 0.8537469 0.6106199 0.525
#> 6 pmax(time - 2, 0) dead 0.8537469 -0.3588023 -0.410The partial proportional-odds slopes are close to the simulated ones, while the proportional-odds model replaces them with one compromise slope for each time term. Both models estimate the treatment effect well; the simulated value is \(\log(0.8) \approx -0.22\):
#>         PO        PPO  simulated
#> -0.2041328 -0.2037432 -0.2231436
Compare model fit
The Akaike information criterion, AIC(), measures how
well a model fits the data while penalizing each extra coefficient by 2
units; lower values are better. The Bayesian information criterion,
BIC(), penalizes each coefficient by the logarithm of the
number of observations instead. A difference of more than about 10 is
usually regarded as strong evidence for the model with the lower value.
Because the proportional-odds model is the partial proportional-odds
model with the time slopes forced to be equal, we can also compare them
with a likelihood ratio test, VGAM::lrtest().
data.frame(
  model = c("Proportional odds", "Partial proportional odds"),
  coefficients = c(length(coef_po), length(coef_ppo)),
  AIC = c(AIC(fit_po$vglm_fit), AIC(fit_ppo$vglm_fit)),
  BIC = c(BIC(fit_po$vglm_fit), BIC(fit_ppo$vglm_fit))
)
#> model coefficients AIC BIC
#> 1 Proportional odds 10 9181.762 9263.240
#> 2 Partial proportional odds 14 9152.277 9266.347
VGAM::lrtest(fit_ppo$vglm_fit, fit_po$vglm_fit)#> Likelihood ratio test
#>
#> Model 1: ordered(y) ~ tx + time + pmax(time - 2, 0) + yprev + age + sofa
#> Model 2: ordered(y) ~ tx + time + pmax(time - 2, 0) + yprev + age + sofa
#> #Df LogLik Df Chisq Pr(>Chisq)
#> 1 76597 -4562.1
#> 2 76601 -4580.9 4 37.485 1.431e-07 ***
#> ---
#> Signif. codes: 0 '***' 0.001 '**' 0.01 '*' 0.05 '.' 0.1 ' ' 1AIC and the likelihood ratio test strongly favour the partial proportional-odds model. BIC is about the same for both models: with about 25,500 daily observations it charges about 10 units for each of the four extra coefficients, which nearly cancels their improvement in fit.
Compare state occupancy probabilities
avg_sops() estimates, for each arm, the probability of
each state on each day, averaged over the patients’ observed starting
states and covariates (see vignette("full-po-sops")). We
compare both models’ estimates with the observed proportion of patients
in each state, separately for each arm. Only point estimates are needed
here, so we do not call inferences().
sop_args <- list(
  variables = list(tx = c(0, 1)),
  times = seq_len(FOLLOW_UP),
  y_levels = STATE_LEVELS,
  absorb = ABSORB
)
sop_po <- do.call(avg_sops, c(list(fit_po), sop_args))
sop_ppo <- do.call(avg_sops, c(list(fit_ppo), sop_args))

observed <- as.data.frame(
  prop.table(
    table(
      tx = raw_data$tx,
      time = raw_data$time,
      state = factor(raw_data$y, levels = STATE_LEVELS)
    ),
    margin = c(1, 2)
  ),
  responseName = "estimate"
)

sop_comparison <- rbind(
  data.frame(source = "Observed", observed[, c("tx", "time", "state", "estimate")]),
  data.frame(source = "Proportional odds", as.data.frame(sop_po)[, c("tx", "time", "state", "estimate")]),
  data.frame(source = "Partial proportional odds", as.data.frame(sop_ppo)[, c("tx", "time", "state", "estimate")])
)
sop_comparison$time <- as.integer(as.character(sop_comparison$time))
sop_comparison$source <- factor(
  sop_comparison$source,
  levels = c("Observed", "Proportional odds", "Partial proportional odds")
)
ggplot(
  subset(sop_comparison, tx == 0),
  aes(time, estimate, colour = source, linetype = source)
) +
  geom_line() +
  facet_wrap(~state, scales = "free_y", labeller = label_both, ncol = 2) +
  labs(
    x = "Day",
    y = "State occupancy probability",
    colour = NULL,
    linetype = NULL,
    title = "Control arm"
  ) +
  theme(legend.position = "bottom")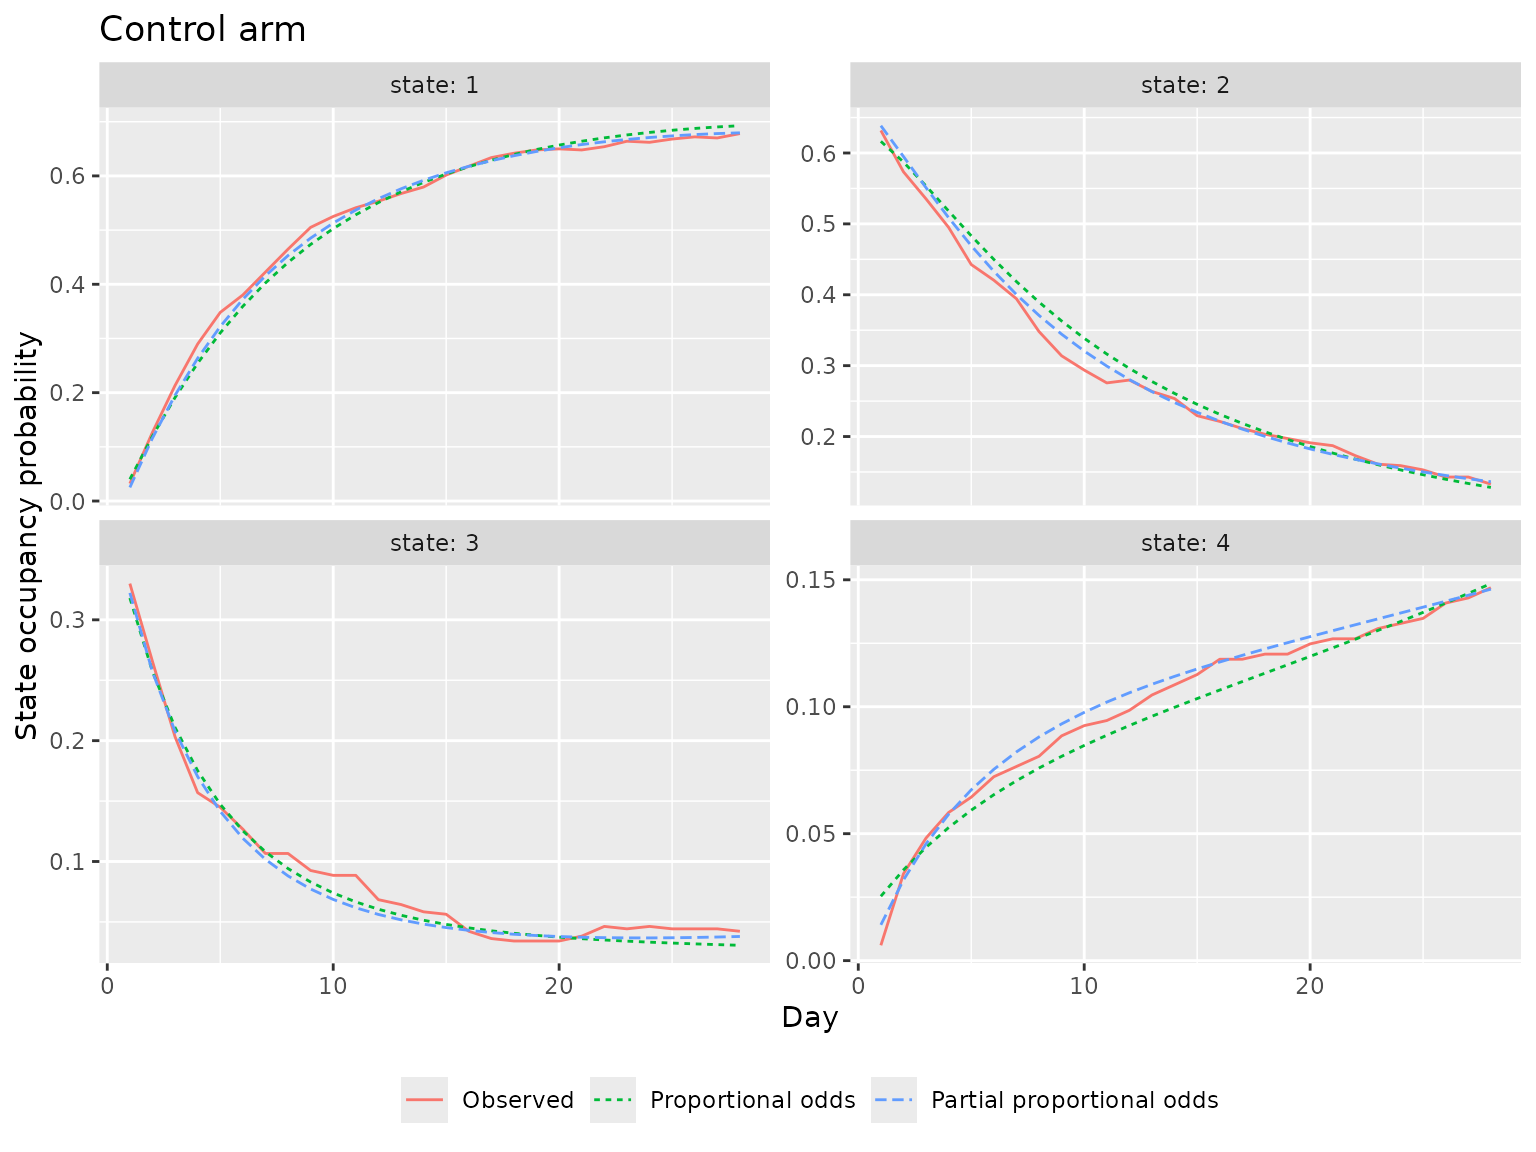
Both models follow the observed proportions closely, but the proportional-odds model makes two systematic errors. It sends patients home too slowly in the second week, leaving about 3 percentage points too many in hospital, and it puts too many deaths on day 1 and too few during the second and third weeks. The mean absolute difference from the observed proportions over all days, states, and arms summarizes this:
sop_wide <- reshape(
  sop_comparison,
  idvar = c("tx", "time", "state"),
  timevar = "source",
  direction = "wide"
)
c(
  `Proportional odds` = mean(abs(
    sop_wide$`estimate.Proportional odds` - sop_wide$estimate.Observed
  )),
  `Partial proportional odds` = mean(abs(
    sop_wide$`estimate.Partial proportional odds` - sop_wide$estimate.Observed
  ))
)
#> Proportional odds Partial proportional odds
#> 0.011644728 0.007905667Compare transitions
plot_transitions() shows, for selected days, the
proportion of all patients who move from each previous state (x-axis) to
each current state (y-axis). For the observed data these are counts
divided by the number of patients; for a model they are the expected
proportions implied by its transition probabilities.
transition_sources <- list(
  Observed = plot_transitions(
    raw_data,
    times = seq_len(FOLLOW_UP),
    y_levels = STATE_LEVELS
  ),
  `Proportional odds` = plot_transitions(
    fit_po,
    times = seq_len(FOLLOW_UP),
    y_levels = STATE_LEVELS,
    absorb = ABSORB
  ),
  `Partial proportional odds` = plot_transitions(
    fit_ppo,
    times = seq_len(FOLLOW_UP),
    y_levels = STATE_LEVELS,
    absorb = ABSORB
  )
)
transitions <- do.call(rbind, Map(
  function(plot, source) {
    data.frame(
      source = source,
      time = as.integer(as.character(plot$data$.time_key)),
      previous_state = plot$data$previous_state,
      state = plot$data$state,
      estimate = plot$data$estimate
    )
  },
  transition_sources,
  names(transition_sources)
))
transitions$source <- factor(transitions$source, levels = names(transition_sources))
ggplot(
  subset(transitions, time %in% c(2, 7, 14, 28)),
  aes(previous_state, state, fill = estimate)
) +
  geom_tile(colour = "white") +
  facet_grid(source ~ time, labeller = labeller(time = function(x) paste("Day", x))) +
  scale_fill_viridis_c(trans = "sqrt", limits = c(0, NA)) +
  coord_equal() +
  labs(x = "Previous state", y = "Current state", fill = "Proportion")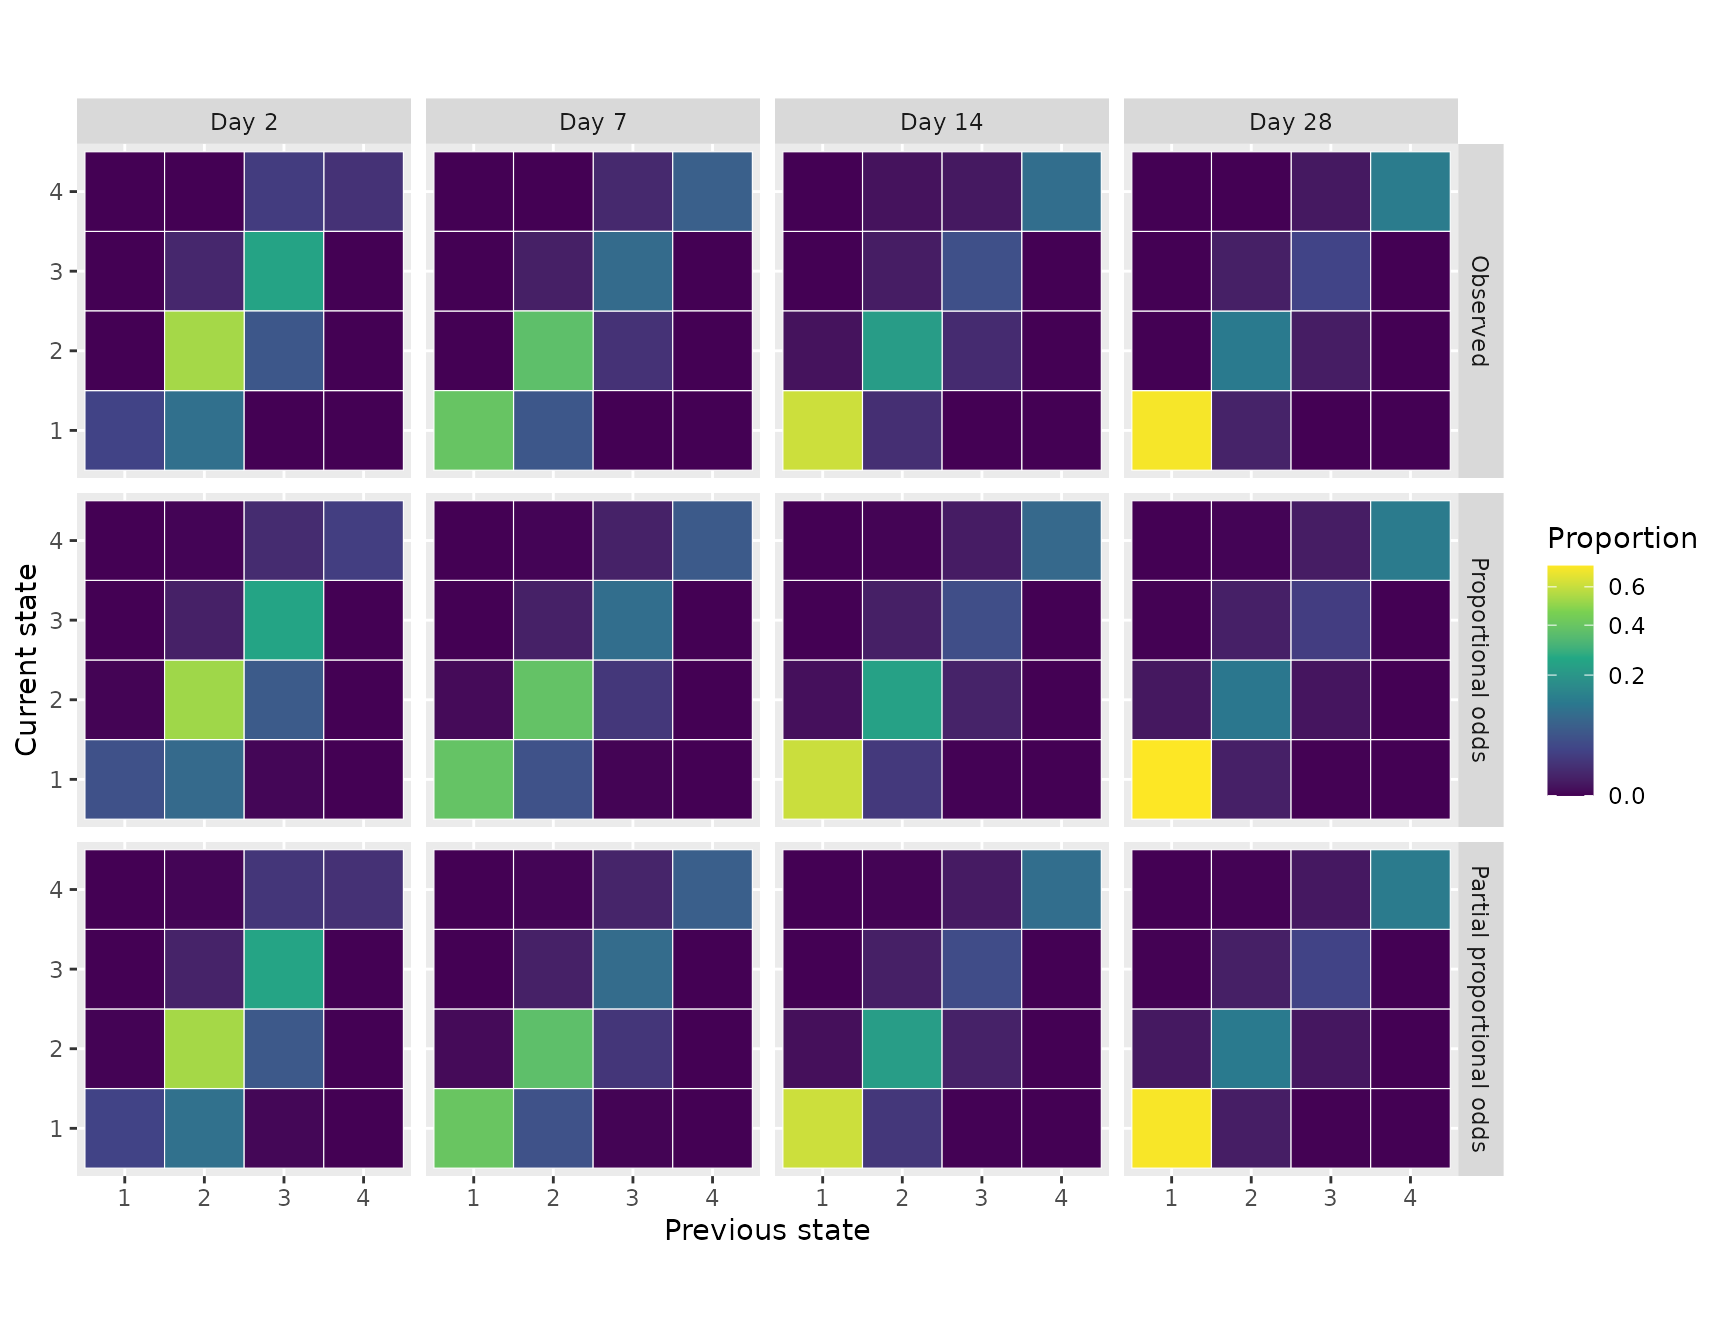
Most patients stay in their previous state, so the diagonal dominates all three rows. Differences between the models appear in the smaller off-diagonal proportions. The plotted values are easier to compare directly over time. For example, the proportion of patients who die on each day after being on a ventilator or with ARDS the day before:
ggplot(
  subset(transitions, previous_state == "3" & state == "4"),
  aes(time, estimate, colour = source, linetype = source)
) +
  geom_line() +
  labs(
    x = "Day",
    y = "Proportion of patients",
    colour = NULL,
    linetype = NULL,
    title = "Moves from ventilator or ARDS (state 3) to death (state 4)"
  )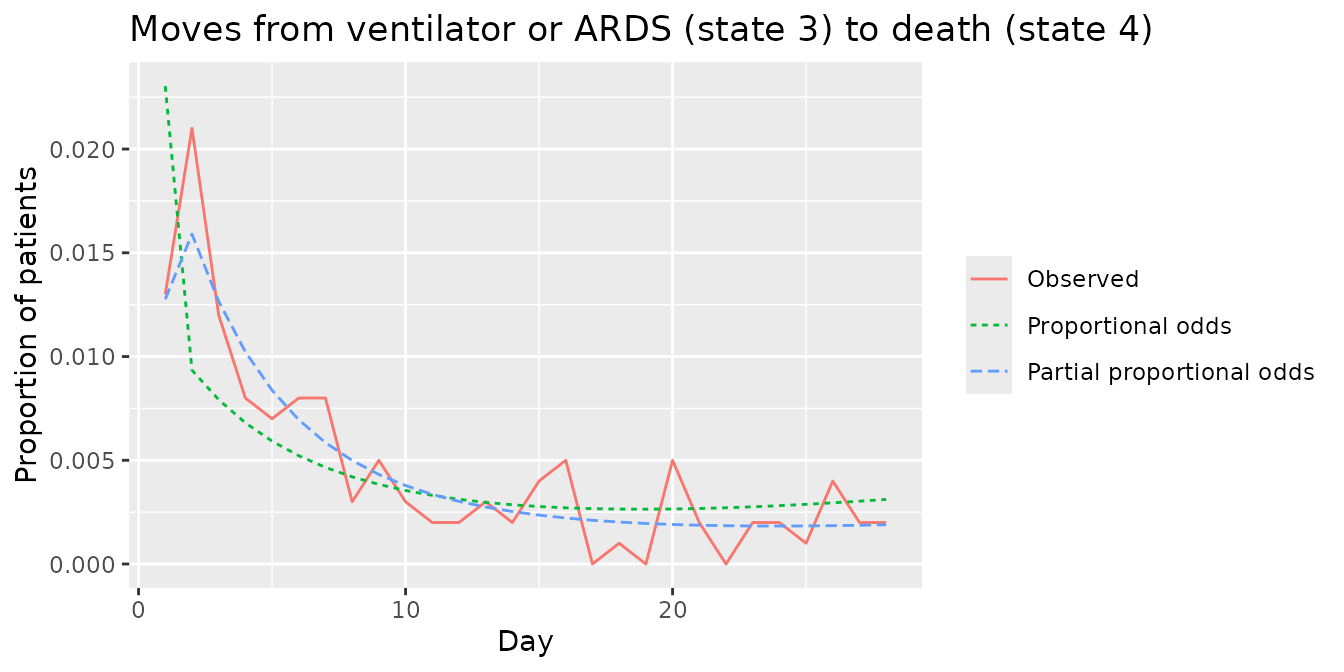
The proportional-odds model, which must give death the same time trend as leaving hospital, overestimates these deaths on day 1 and underestimates them during the following week. The partial proportional-odds model follows the observed proportions.
Compare correlations between days
plot_correlation() shows the Spearman rank correlation
between patients’ states on every pair of days, from the observed data
or implied by a model.
correlation_days <- seq(1, FOLLOW_UP, by = 3)

correlation_plots <- list(
  plot_correlation(
    raw_data,
    times = correlation_days,
    fill_limits = c(0, 1),
    show_values = FALSE
  ) +
    labs(title = "Observed"),
  plot_correlation(
    fit_po,
    times = correlation_days,
    y_levels = STATE_LEVELS,
    absorb = ABSORB,
    fill_limits = c(0, 1),
    show_values = FALSE
  ) +
    labs(title = "Proportional odds"),
  plot_correlation(
    fit_ppo,
    times = correlation_days,
    y_levels = STATE_LEVELS,
    absorb = ABSORB,
    fill_limits = c(0, 1),
    show_values = FALSE
  ) +
    labs(title = "Partial proportional odds")
)
wrap_plots(correlation_plots, nrow = 1) + plot_layout(guides = "collect")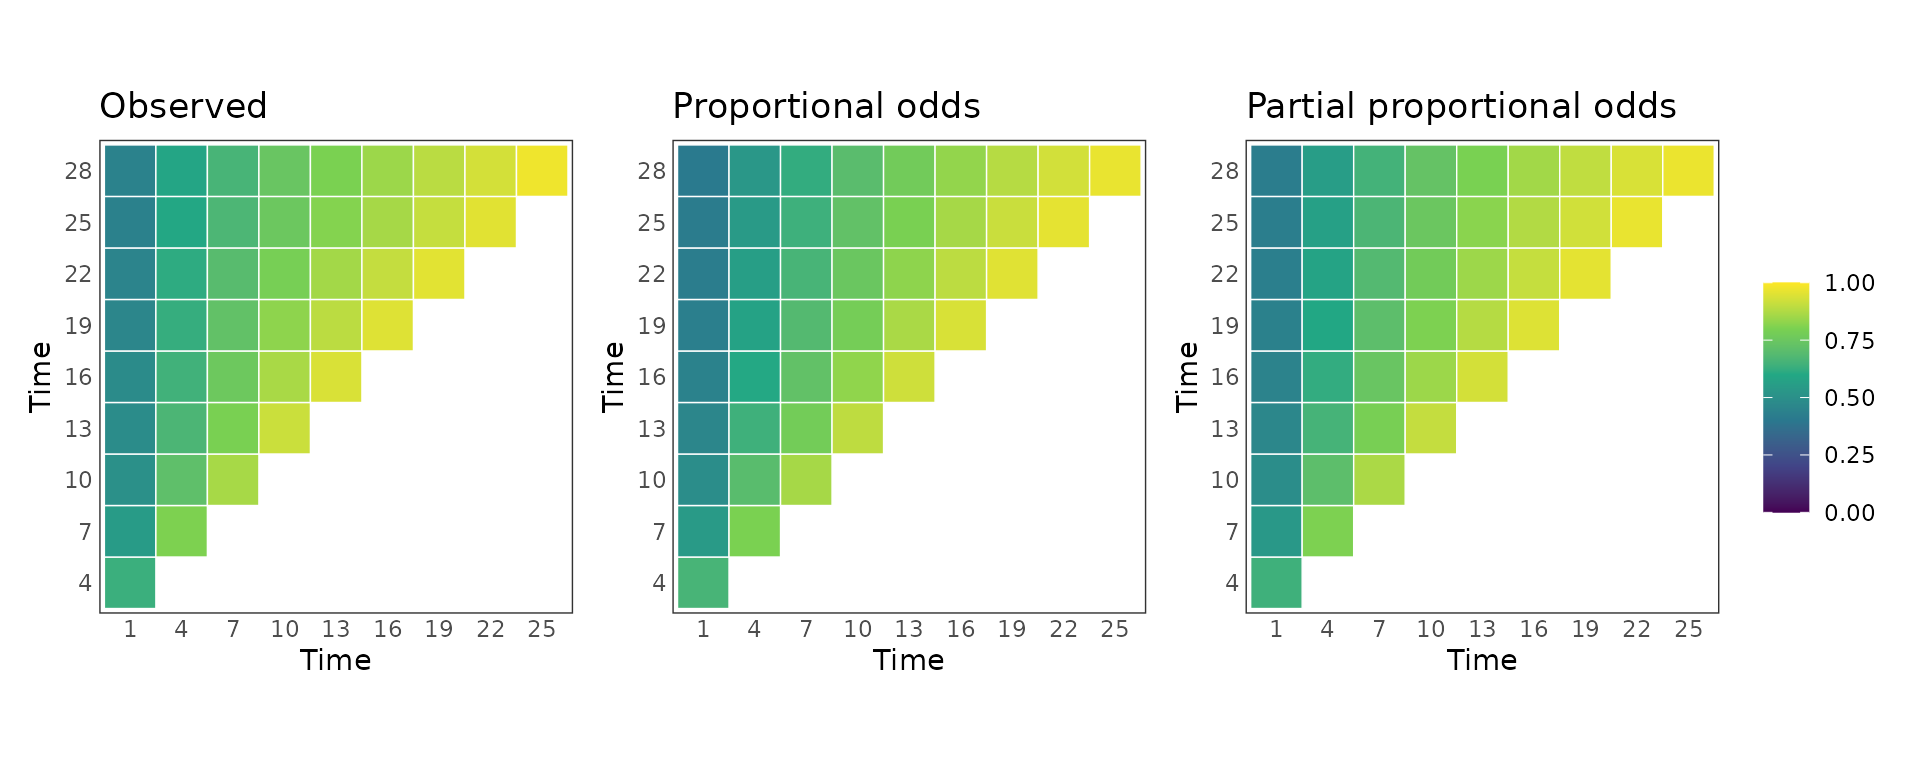
All three plots look almost the same. Correlations between days depend mainly on how strongly patients tend to stay in their previous state, which both models capture.
Compare treatment effects on time in each state
avg_comparisons() with
estimand = "time_in_state" sums each arm’s daily SOPs over
follow-up. The result is the expected number of days spent in each
state, and the comparison reports treated minus control. A positive
difference for state 1 means that treated patients are expected to spend
more of the 28 days at home.
Analytical confidence intervals (method = "delta") are
available only for full proportional-odds models, so for the partial
proportional-odds model we use method = "mvn". It draws
coefficient vectors from a multivariate normal distribution centered on
the estimates, with the model’s covariance matrix, recomputes the result
for each draw, and takes percentiles. We use only 100 draws to keep this
example fast; use more, such as 1,000, in a real analysis.
tis_args <- list(
  estimand = "time_in_state",
  variables = list(tx = c(0, 1)),
  times = seq_len(FOLLOW_UP),
  y_levels = STATE_LEVELS,
  absorb = ABSORB
)

tis_po <- do.call(avg_comparisons, c(list(fit_po), tis_args)) |>
  inferences(method = "delta", vcov = "conditional")
tis_ppo <- do.call(avg_comparisons, c(list(fit_ppo), tis_args)) |>
  inferences(method = "mvn", n_draws = 100, seed = SEED)

tis_comparison <- rbind(
  data.frame(model = "Proportional odds", as.data.frame(tis_po)),
  data.frame(model = "Partial proportional odds", as.data.frame(tis_ppo))
)
tis_comparison$model <- factor(
  tis_comparison$model,
  levels = c("Proportional odds", "Partial proportional odds")
)
tis_comparison[, c("model", "state_set", "estimate", "conf.low", "conf.high")]
#> model state_set estimate conf.low conf.high
#> 1 Proportional odds 1 1.8752285 0.8131048 2.9373522
#> 2 Proportional odds 2 -0.8244368 -1.2930746 -0.3557990
#> 3 Proportional odds 3 -0.3558708 -0.5712673 -0.1404743
#> 4 Proportional odds 4 -0.6949209 -1.0926051 -0.2972368
#> 5 Partial proportional odds 1 1.8786564 0.9946950 2.6749667
#> 6 Partial proportional odds 2 -0.8019359 -1.1346815 -0.4252286
#> 7 Partial proportional odds 3 -0.3483158 -0.5055796 -0.1772689
#> 8 Partial proportional odds 4 -0.7284046 -1.0733325 -0.3814286
ggplot(
  tis_comparison,
  aes(state_set, estimate, ymin = conf.low, ymax = conf.high, colour = model)
) +
  geom_hline(yintercept = 0, colour = "grey60") +
  geom_pointrange(position = position_dodge(width = 0.5)) +
  labs(
    x = "State",
    y = "Difference in days (treated - control)",
    colour = NULL
  ) +
  theme(legend.position = "bottom")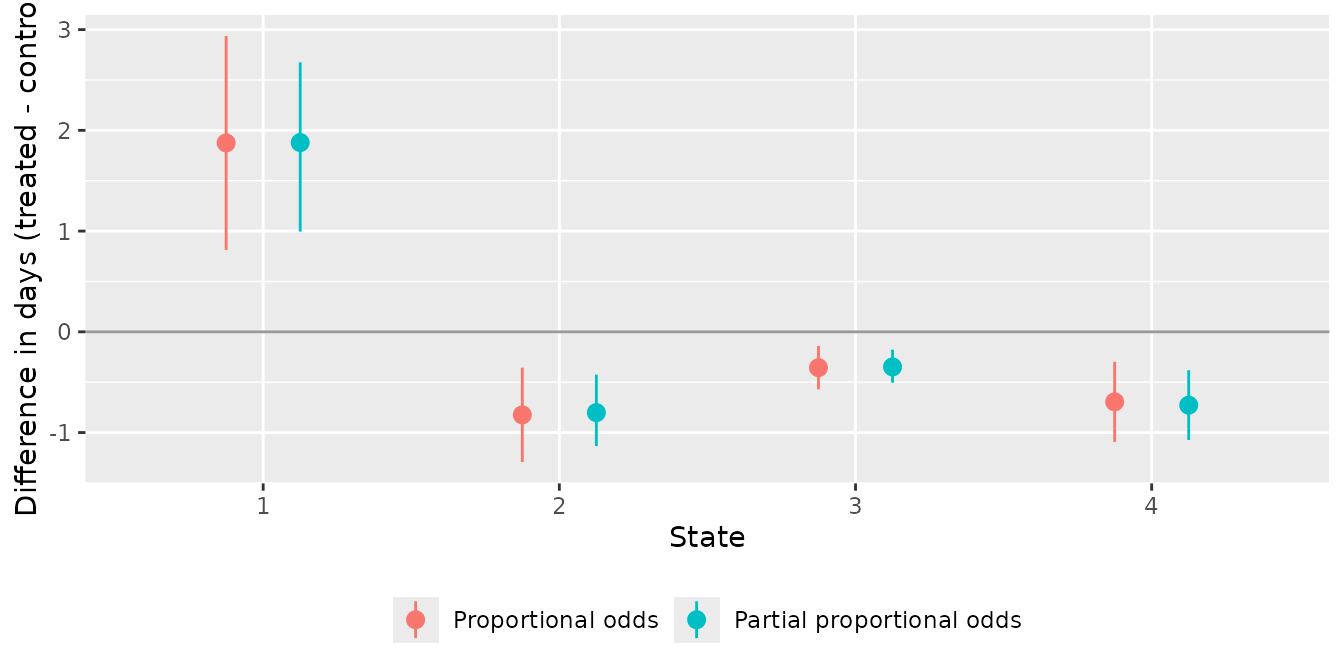
The two models give similar treatment effects even though their SOPs differ.